There have been a flurry of headlines lately announcing large-scale renewable energy plans.
Here are just a few of the recent news clips:
- Fast-Track Solar Development Zones Identified: The U.S. Department of the Interior has published a “Solar Programmatic Environmental Impact Statement,” which, among other items, establishes a framework for fast-tracking solar development within 17 regional zones with the goal of bringing online nearly 24 gigawatts (GW) of solar power by 2030. (Source: BuildingGreen, Inc.)
- Twin Cities IKEA Powers Up Minnesota’s Largest Solar Array: On August 28th, IKEA, the world’s leading home furnishings retailer, activated a 1 megawatt (MW) (1,014 kW) solar installation at its Twin Cities store in Bloomington, Minnesota – the state’s largest such solar electric installation. (Source: Inhabitat)
- Wal-Mart Beats Apple, Ikea In U.S. Solar Installations: Wal-Mart Stores Inc., the world’s largest retailer, has installed more than 150 U.S. solar projects and expects to have as much as 90 MW of capacity by year-end. (Source: Bloomberg News)
.
While these figures might sound impressive at first brush, my question is: How is the public suppose to put a megawatt or gigawatt into perspective?
.
Admittedly, some writers will follow the capacity figures with equivalents in terms of houses. However, I have found those numbers to be inconsistent.
.
The following is a straightforward methodology for putting solar capacity figures into perspective. I hope it is helpful. I certainly welcome any critiques if there is a way that I can improve this approach.
.
.
Step 1: Determine how much energy the typical U.S. residence consumes in a year.
.
According to the most recent (November 2011) data released by the U.S. Department of Energy’s Energy Information Administration (EIA), the average U.S. residence consumes 958 kilowatt-hours (kWh) of electricity per month. That translates into 11,496 kWh per year.
.
.
Step 2: Determine a reasonable representative location for “average solar radiation.”
.
This part was tricky. I consulted long-term solar radiation data from the U.S. Department of Energy’s National Renewable Energy Laboratory (NREL) and cross-referenced the data with available weather stations from which such data is recorded. Long story short, I decided upon Columbia, Missouri.
.
.
Step 3: Figure out how large of a solar power installation would be necessary to provide 100% of the electricity consumed by the residence defined in Step 1 if it was located in the representative location identified in Step 2.
.
Specifically, I needed to calculate how large of a photovoltaic (PV) solar array would be necessary to produce at least 11,496 kWh annually if it was located in Columbia, Missouri.
.
For this step, I utilized PVWatts v1 (a free online resource from NREL) and assumed all of the default settings regarding direct current (DC) to alternating current (AC) derate factor (0.77), array type (fixed tilt), array tilt (the latitude or 38.8°), and array azimuth (180.0°).
.
The result: The nameplate DC power rating (i.e., the system’s rated capacity) for the PV array would need to be 9 kW and the system would produce (on average) 11,886 kWh of AC energy.
.
In a nutshell, this methodology suggests that an average home would need a 9 kW array if it receives an average amount of solar radiation relative to the rest of the continental U.S.
.
.
 |
| Illustration by Daniel Overbey |
Putting a “megawatt” into perspective.
.
At this point, we can use the information from above to put a megawatt into perspective.
.
A kilowatt (kW) = 1,000 watts (W)
.
A megawatt (MW) = 1,000 kW (or 1,000,000 W)
.
If a rated 9 kW photovoltaic system is the size needed to provide 100% of the annual electricity consumed by an average residence with average solar radiation access, then a rated 1 MW of installed capacity in the same location would produce enough power 111 residences.
.
 |
| Illustration by Daniel Overbey |
Putting a “gigawatt” into perspective.
.
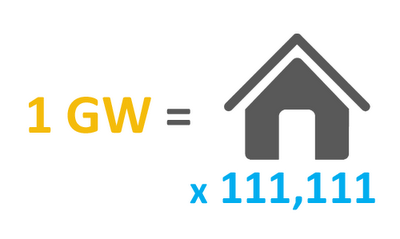
Following this logic, 1 GW of installed solar capacity at the same location would produce enough power for 111,111 homes.
.
To put the number of homes into perspective, the latest US census data (2006-2010) recorded 114,235,996 households in the US. 111,111 homes accounts for just under one-tenth of one percent of the country’s total residences.
.
 |
| Illustration by Daniel Overbey |
The necessary qualifiers.
.
This analysis sheds light on the dubiousness of these “equivalent” household figures in the news briefs. Sure, they help a general audience to put solar capacity figures into perspective, but the picture provided is painted with a very broad brush.
A 9 kW solar array in Columbia, Missouri may produce an average of 11,886 kWh/yr. However, an identical system in Las Vegas, Nevada, would produce an average of 14,972 kWh annually – that is a 30% increase.
Moreover, the average residence consumes 13,836 kWh/yr in Missouri versus 10,968 kWh/yr in Nevada.
As you can see, assumptions and qualifiers can make an enormous difference when comparing different solar power projects and their “equivalent” household figures.
